

You can find on this page the Belgium population map to print and to download in PDF. The Belgium population density map presents the number of inhabitants in relation to the country size and the structure of the population of Belgium in Western Europe.
The Belgium population density map shows the number of inhabitants in relation to Belgium size. This demographic map of Belgium will allow you to know demography and structure of the population of Belgium in Western Europe. The Belgium density map is downloadable in PDF, printable and free.
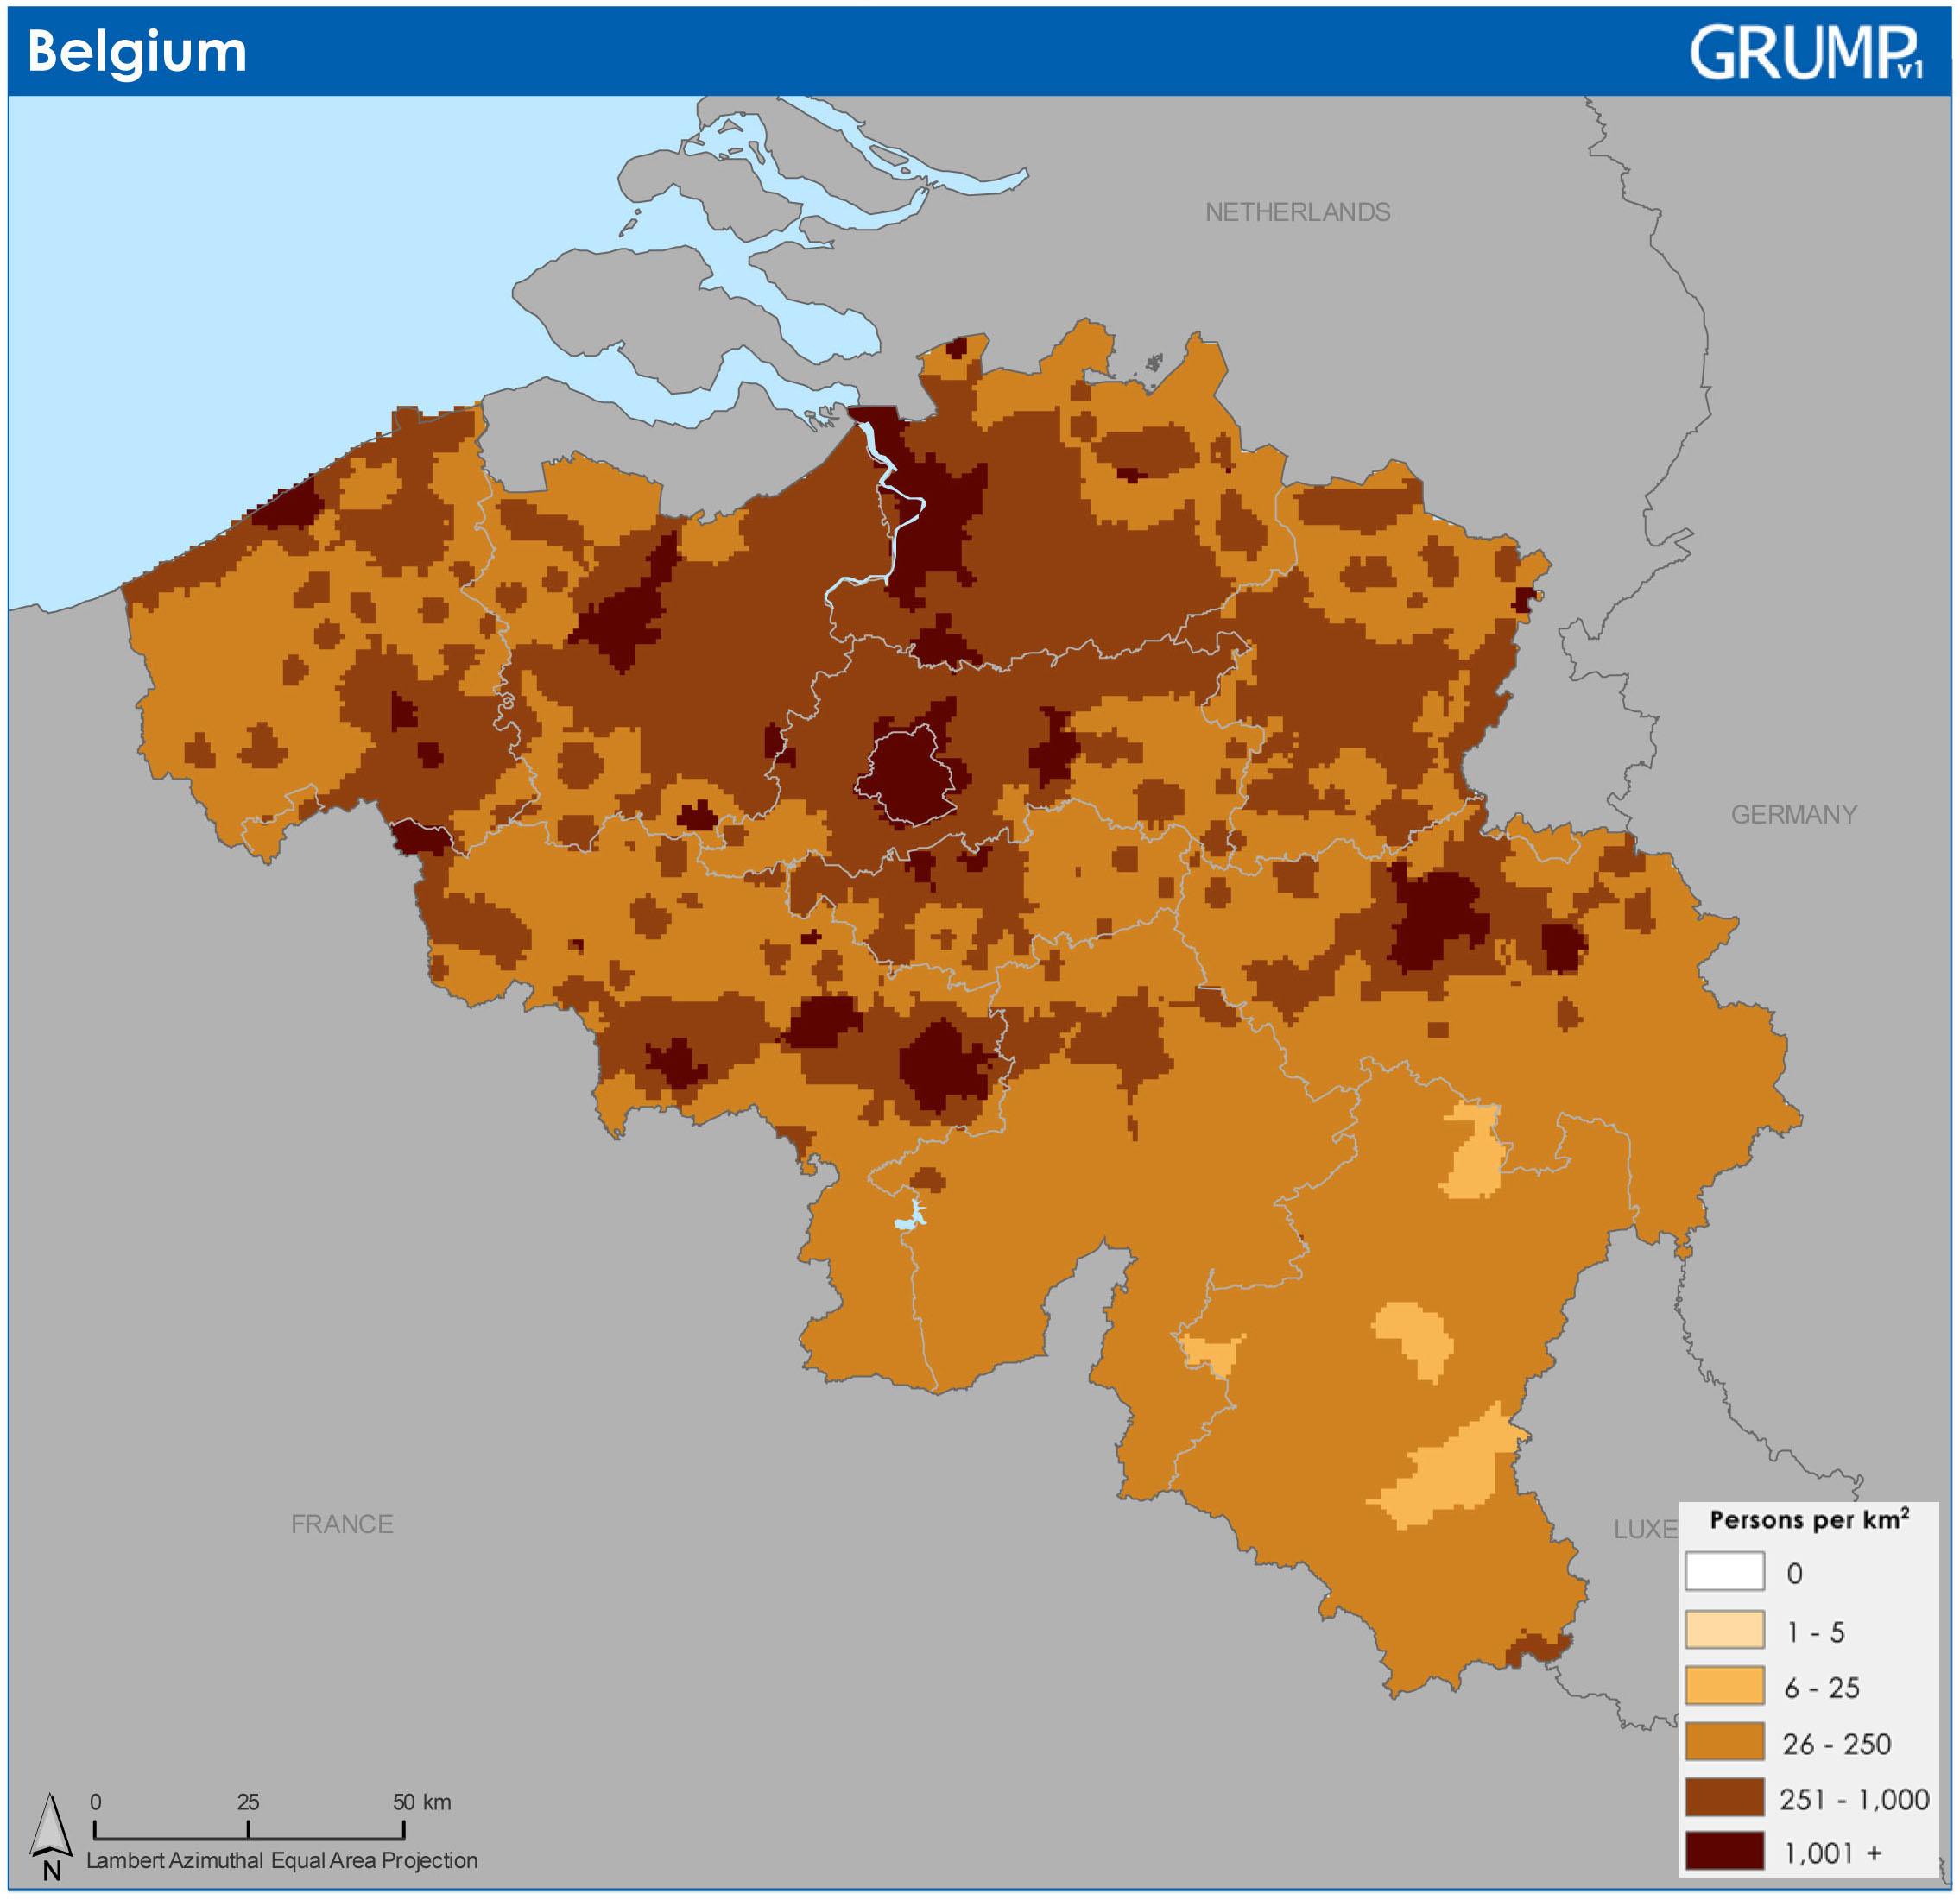
Belgium ranks number 81 in the list of countries (and dependencies) by population. The population density in Belgium is 383 per Km2 (991 people per mi2). 98.3 % of the population is urban (11,396,775 people in 2020) as you can see in Belgium population density map. The median age in Belgium is 41.9 years. Unlike many other developed countries, Belgium is projected to continue growing throughout the rest of the 21st century. Belgium population is currently 11.59 million people, which is expected to grow to 12.48 million people by the end of 2099. Belgium is growing at a low, steady pace of 0.44%, adding about 50,300 people to the population every year. This low population growth rate is good for a country that is already fairly densely populated. Belgium has a net migration of about 48,000 per year and a fertility rate of 1.71 births per woman.
The rate of growth in Belgium has not bee terribly high over the past century, steadily sitting around an annual growth rate of 0.50%, and this number is supposed to get smaller in the years to come. As of 2019, the growth rate in Belgium is 0.56%, which is expected to decrease to just 0.14% by 2050. With numbers this small, Belgium likely wont see an increase of over one million people in the next 30 years or so. Current projections say that the population will be 11,619,972 in 2020, 12,001,594 in 2030, 12,293,880 in 2040 and 12,488,233 in 2050 as its shown in Belgium population density map. The international migration balance in Belgium was +41,756 in 2020. This is a rather sharp decline compared to the previous year: in 2019, this balance was still +55,031. In 2020, both immigration and emigration decreased. Immigration fell from 174,591 in 2019 to 144,169 in 2020 (-17.4%). Emigration also decreased from 119,560 in 2019 to 102,413 in 2020 (-14.3%). These decreases are most likely (partly) due to the Covid-19 pandemic, which also restricted the movement of people.
In Belgium in 2020, more people died than babies were born, resulting in a balance of -13,111. In 2019, the natural balance was +8,358. The natural balance has been declining for quite a few years, but the fall in 2020 is very sharp. This is largely due to the Covid-19 pandemic, which caused an increase in the number of deaths: in 2020, 126,850 people died in Belgium, an increase of 16.6% compared to 2019, when 108,745 deaths were counted. At the same time, the number of newborns fell quite sharply: from 117,103 births in 2019 to 113,739 births in 2020 (-2.9%) as its mentioned in Belgium population density map. Between 2018 and 2019, the decrease amounted to -0.6%.